US VC cash flows ($B)
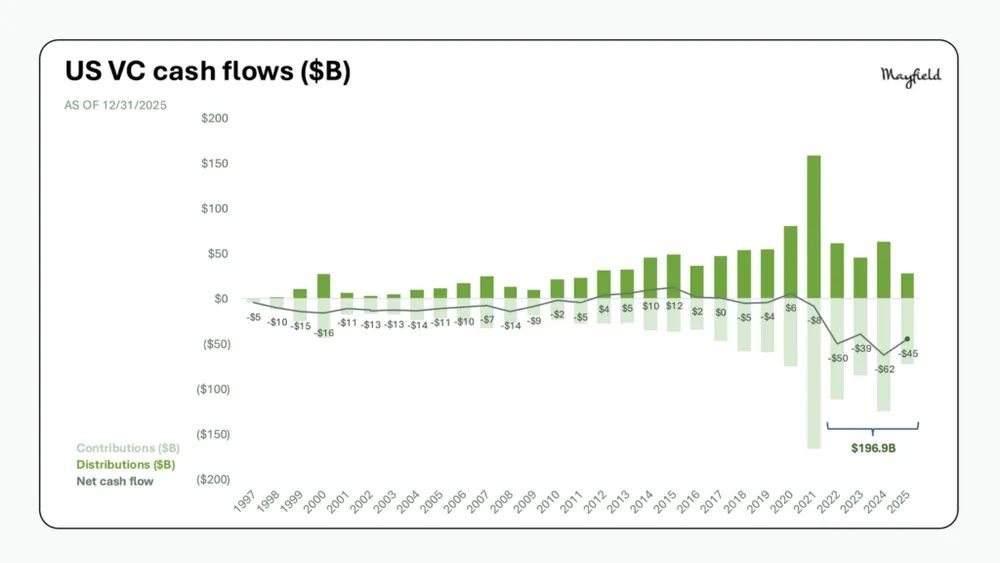
The chart illustrates annual US venture capital contributions, distributions, and net cash flows from 1997 to 2025.
| Label | Value shown on the chart |
|---|---|
| 1997 Net cash flow | -$5 |
| 1998 Net cash flow | -$10 |
| 1999 Net cash flow | -$15 |
| 2000 Net cash flow | -$16 |
| 2021 Net cash flow | -$8 |
| 2022 Net cash flow | -$50 |
| 2023 Net cash flow | -$39 |
| 2024 Net cash flow | -$62 |
| 2025 Net cash flow | -$45 |
Shown as a preview with credit and a link to the original. Publishers can request removal.
View the original on mayfield.com