TTM VC exit value ($B) by type
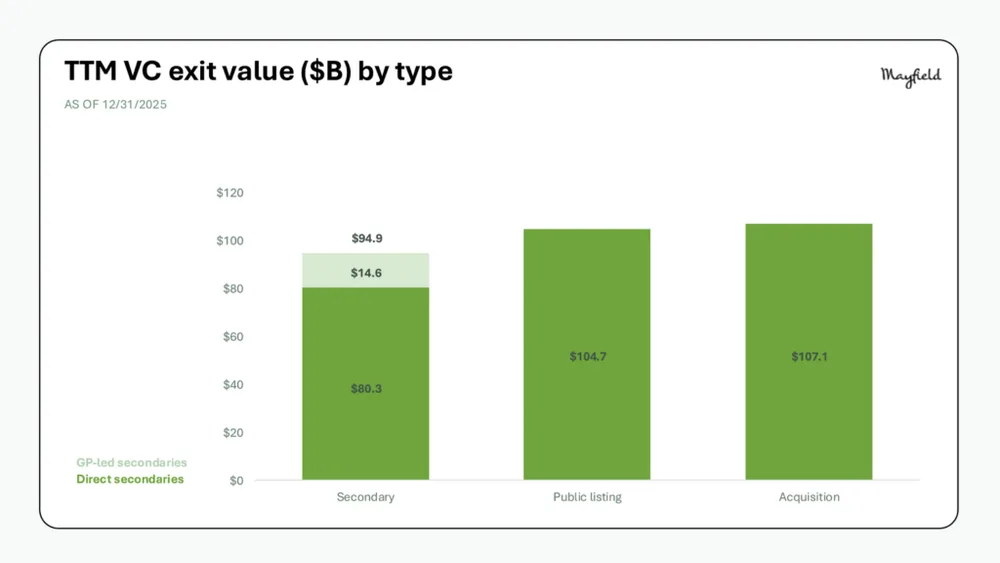
This bar chart displays the trailing twelve months venture capital exit value in billions of dollars by type as of December 31, 2025. Acquisitions lead with $107.1B, followed by public listings with $104.7B, and secondary transactions totaling $94.9B.
| Label | Value shown on the chart |
|---|---|
| Direct secondaries | $80.3 |
| GP-led secondaries | $14.6 |
| Secondary total | $94.9 |
| Public listing | $104.7 |
| Acquisition | $107.1 |
Shown as a preview with credit and a link to the original. Publishers can request removal.
View the original on mayfield.com