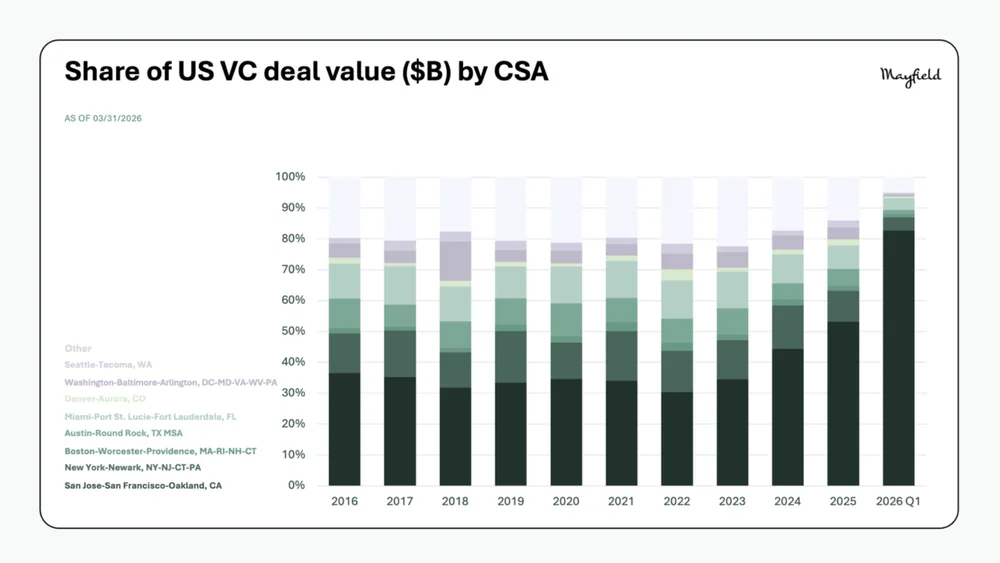
Share of US VC deal value ($B) by CSA
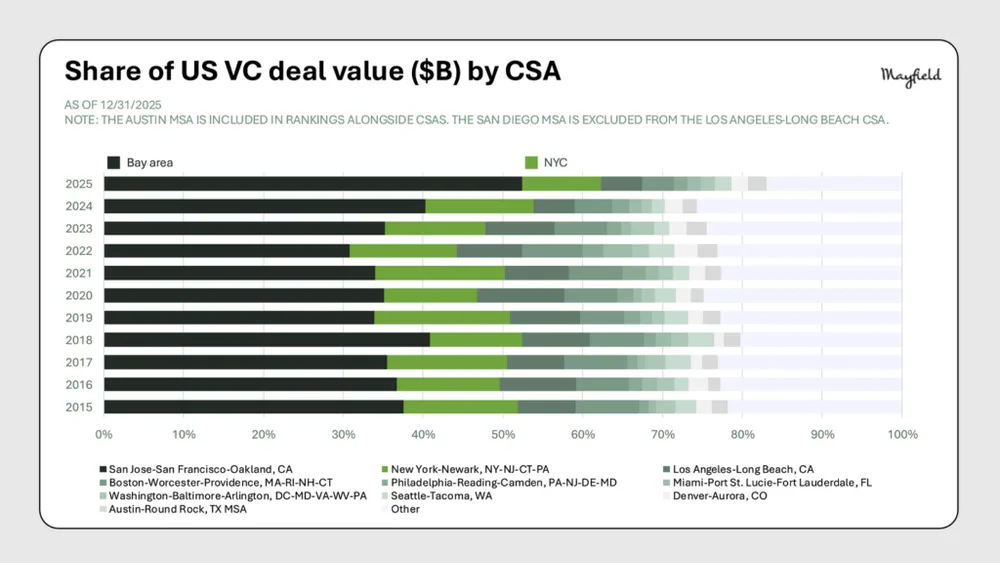
This chart shows the percentage distribution of US venture capital deal value by Combined Statistical Area (CSA) from 2015 to 2025. The San Jose-San Francisco-Oakland area (Bay Area) consistently holds the largest share, followed by New York.
Shown as a preview with credit and a link to the original. Publishers can request removal.
View the original on mayfield.com