Next Quarter Revenue Guidance vs Broker Consensus Estimates
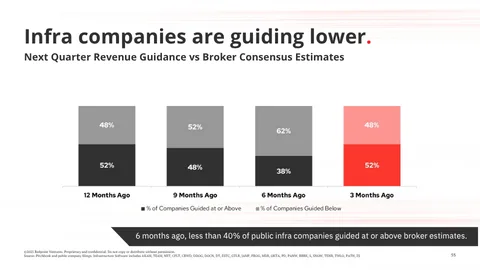
Chart showing the percentage of public infrastructure software companies guiding at/above versus below broker consensus estimates over four time horizons.
| Label | Value shown on the chart |
|---|---|
| 12 Months Ago (At or Above) | 52% |
| 12 Months Ago (Below) | 48% |
| 9 Months Ago (At or Above) | 48% |
| 9 Months Ago (Below) | 52% |
| 6 Months Ago (At or Above) | 38% |
| 6 Months Ago (Below) | 62% |
| 3 Months Ago (At or Above) | 52% |
| 3 Months Ago (Below) | 48% |
Shown as a preview with credit and a link to the original. Publishers can request removal.
View the original on redpoint.com