How Physical AI Engagement Concentrates Across Industry and Budgets
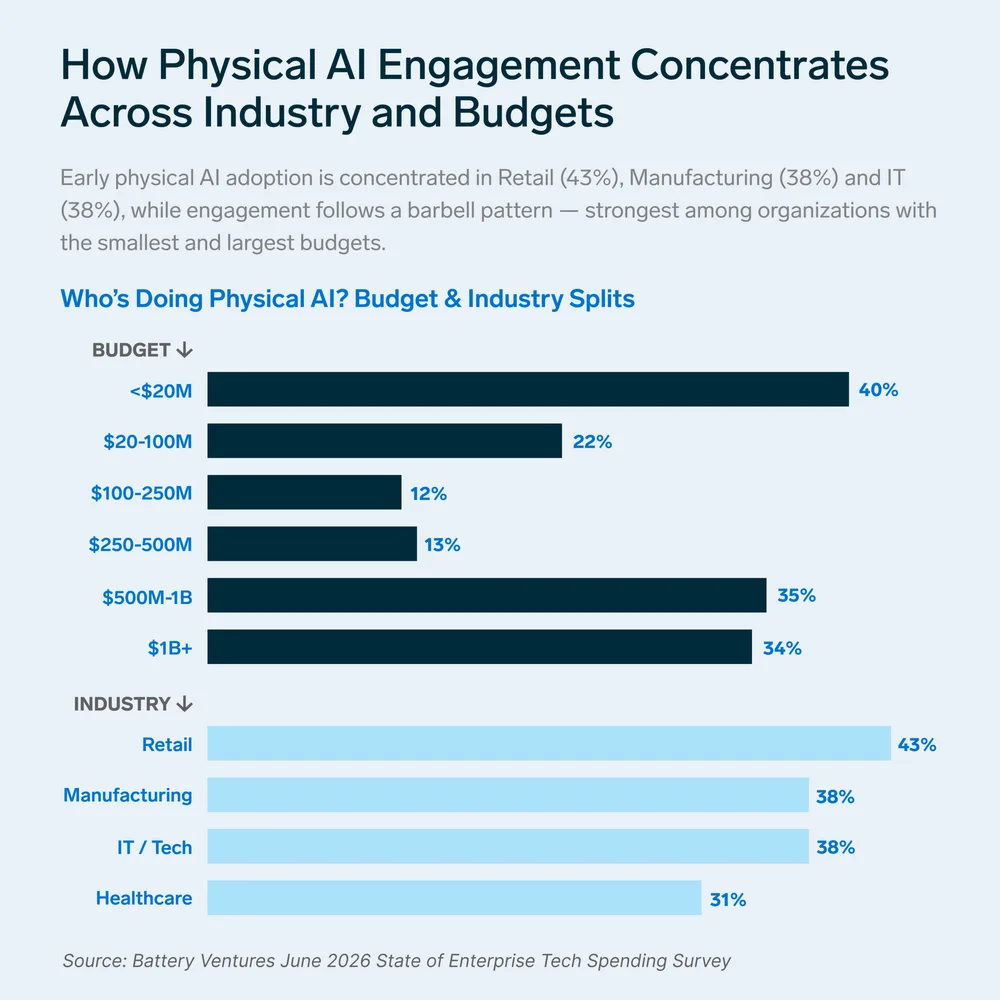
This chart shows physical AI adoption rates across different enterprise budget sizes and industry sectors based on Battery Ventures survey data. Adoption shows a barbell pattern by budget, with the highest engagement among companies with budgets under $20M (40%) and over $500M (34-35%), while Retail leads all industries at 43%.
| Label | Value shown on the chart |
|---|---|
| <$20M | 40% |
| $20-100M | 22% |
| $100-250M | 12% |
| $250-500M | 13% |
| $500M-1B | 35% |
| $1B+ | 34% |
| Retail | 43% |
| Manufacturing | 38% |
| IT / Tech | 38% |
| Healthcare | 31% |
Shown as a preview with credit and a link to the original. Publishers can request removal.
View the original on battery.com