Validation of Capital Structure Models in the Light of Trade-Off Theory: The Case of S&P 500 Companies (Studia i Prace Kolegium Zarządzania i Finansów / Szkoła Główna Handlowa)
SaveSummary
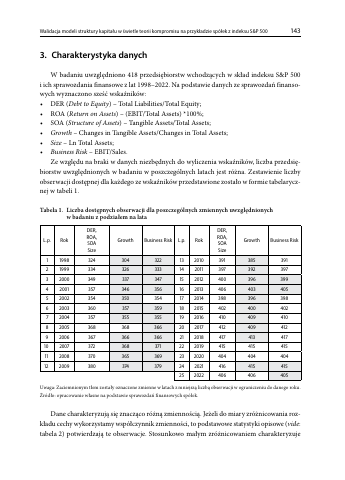
- The study covers 418 S&P 500 companies and their financial statements from 1998–2022, with six ratios derived from them.p.7
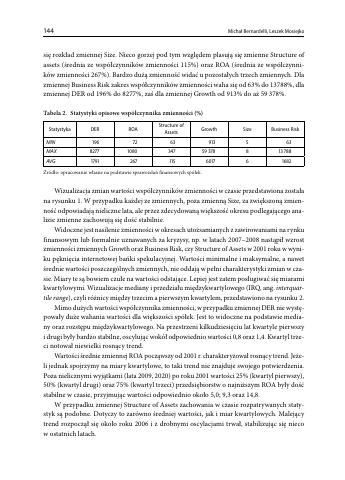
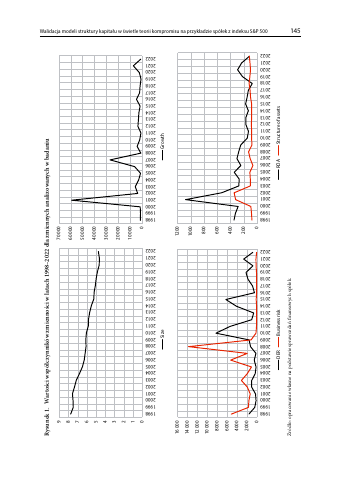
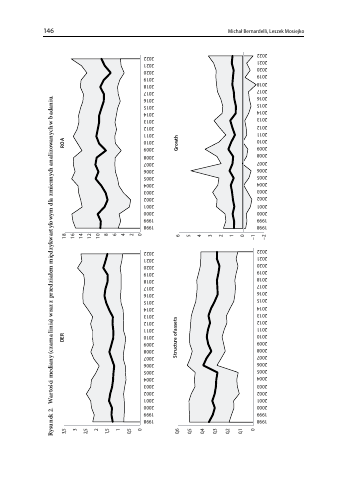
- Coefficients of variation for DER range from 196% to 8277%.p.8
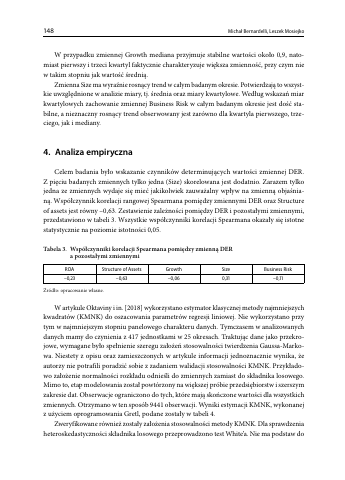
- The Spearman correlation between DER and Structure of Assets is -0.63, the strongest of the five variables.p.12
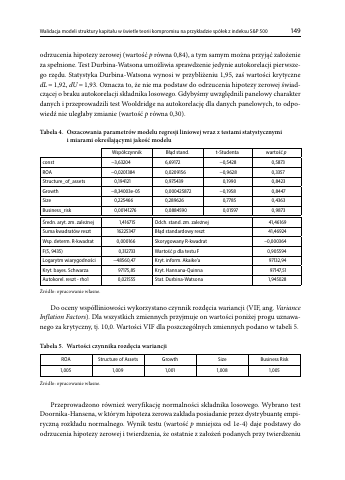
- The linear regression has an R-squared of 0.000166, so it explains practically none of the variation in DER.p.13
- The F-test p-value of 0.905594 indicates the chosen variables are inadequate.p.13
Key insights
- The study extends an earlier analysis by testing its conclusions on a much longer and more recent period.p.3
- DER is defined as Total Liabilities divided by Total Equity.p.7
- The data comprise 417 units over 25 periods, a panel structure the earlier article did not use.p.12
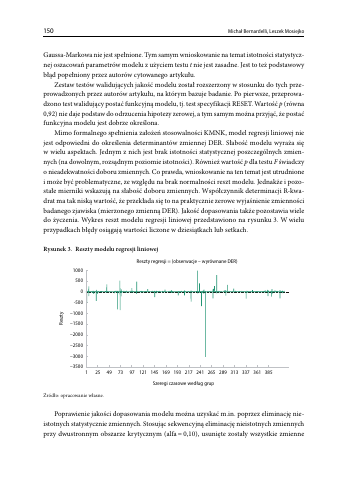
- The RESET specification test returns a p-value of 0.92, so the functional form is acceptably specified.p.14
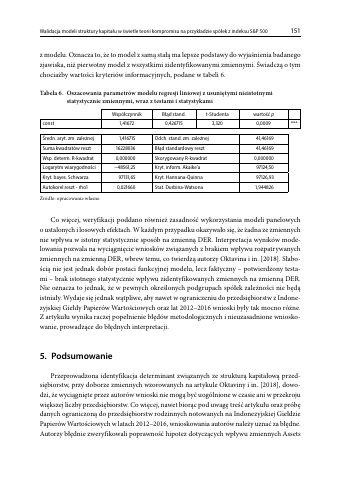
- None of the variables significantly affects DER in the pooled, fixed-effects or random-effects models.p.15
Pages
 p.1
 p.2
 p.3
 p.4
 p.5
 p.6
 p.7
 p.8
 p.9
 p.10
 p.11
 p.12
 p.13
 p.14
 p.15
 p.16
 p.17
 p.18
 p.19
 p.20
Funders mentioned
Topics and entities
Summary and figures generated from the document and checked automatically: every number shown appears on the cited page. Publishers can request removal.