Startups are staying lean for longer
Save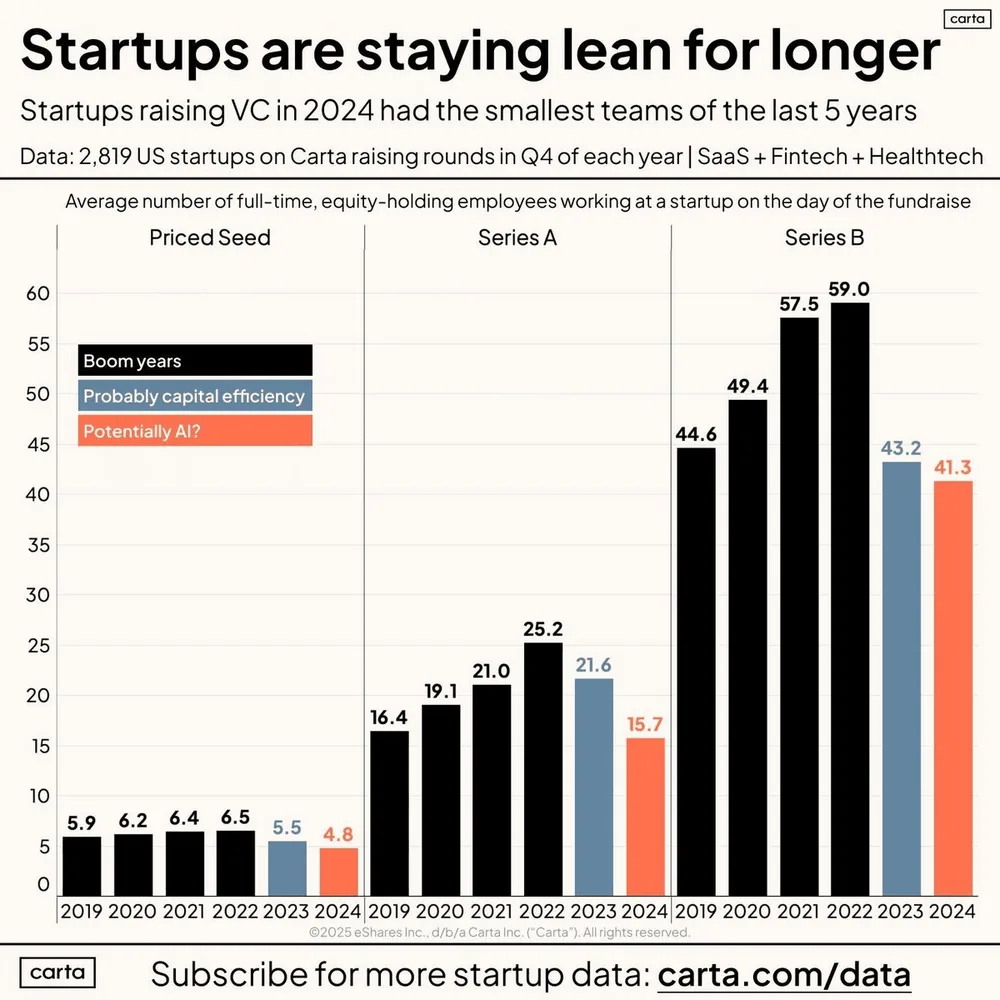
This chart shows the average number of full-time, equity-holding employees at US startups (SaaS, Fintech, Healthtech) on the day of their fundraise across Priced Seed, Series A, and Series B rounds from 2019 to 2024. Headcounts in 2024 reached 5-year lows across all three stages.
| Label | Value shown on the chart |
|---|---|
| Priced Seed 2019 | 5.9 |
| Priced Seed 2022 | 6.5 |
| Priced Seed 2024 | 4.8 |
| Series A 2019 | 16.4 |
| Series A 2022 | 25.2 |
| Series A 2024 | 15.7 |
| Series B 2019 | 44.6 |
| Series B 2022 | 59.0 |
| Series B 2023 | 43.2 |
| Series B 2024 | 41.3 |
Shown as a preview with credit and a link to the original. Publishers can request removal.
View the original on moonfire.com