Charts / Clouded Judgement (Altimeter)
NTM Rev Growth vs NTM Rev Multiple
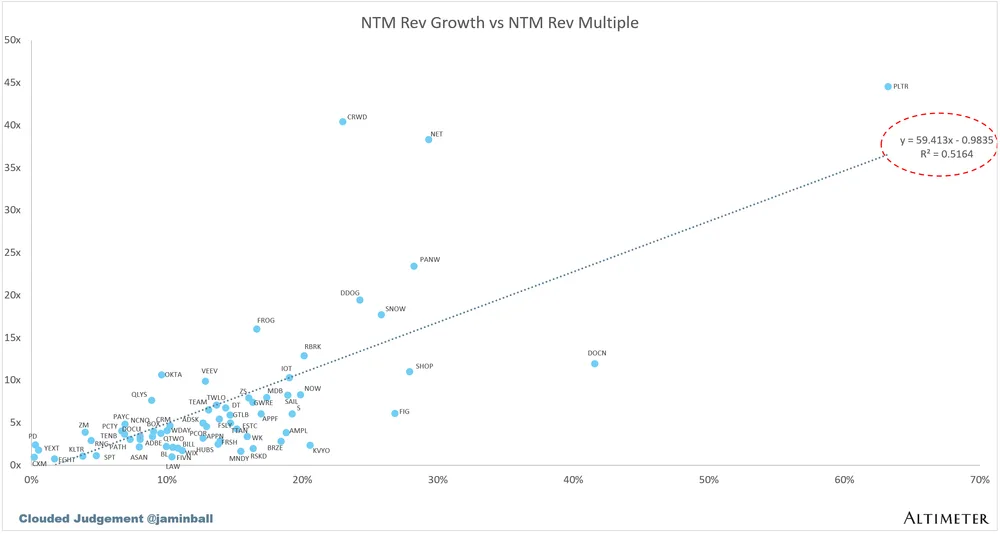
Scatter plot showing the relationship between Next Twelve Months (NTM) revenue growth rate and NTM revenue multiple across software and SaaS companies, displaying a positive linear correlation with an R-squared of 0.5164.
| Label | Value shown on the chart |
|---|---|
| Regression Equation | y = 59.413x - 0.9835 |
| R-squared | 0.5164 |
Shown as a preview with credit and a link to the original. Publishers can request removal.
View the original on cloudedjudgement.substack.com