Charts / Clouded Judgement (Altimeter)
NTM Rev Growth vs NTM Rev Multiple
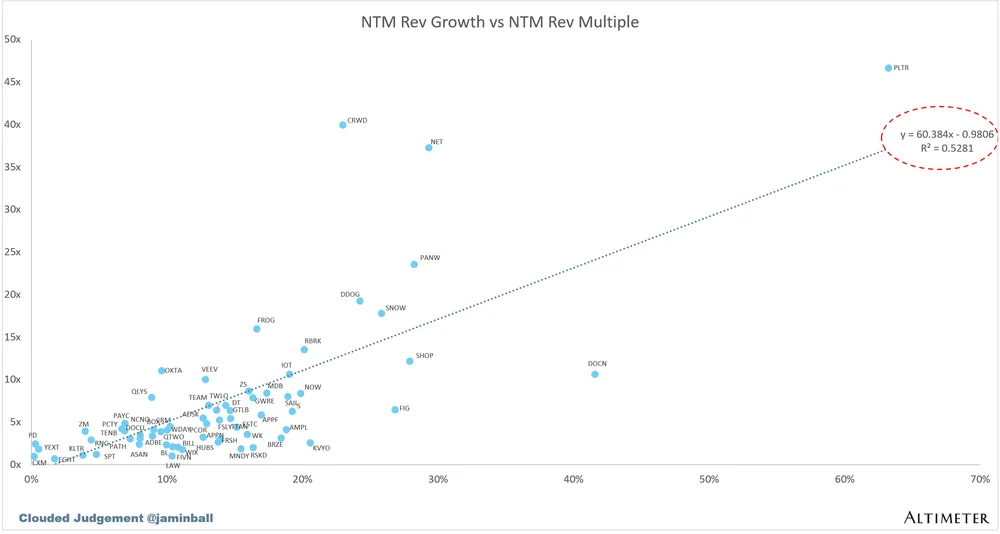
A scatter plot analyzing the correlation between Next Twelve Months (NTM) revenue growth rate and NTM revenue valuation multiple for software companies, highlighting PLTR as a high-multiple outlier.
| Label | Value shown on the chart |
|---|---|
| Regression Equation | y = 60.384x - 0.9806 |
| R² | 0.5281 |
Shown as a preview with credit and a link to the original. Publishers can request removal.
View the original on cloudedjudgement.substack.com