Median Spend by Higher Growth vs. Lower Growth
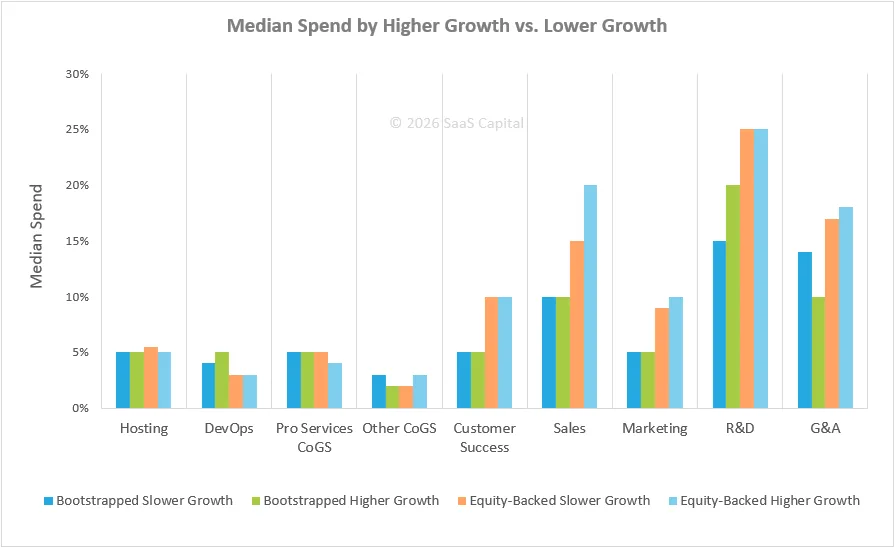
This bar chart compares the median spend percentages across operational departments (such as Hosting, R&D, Sales, and G&A) for bootstrapped and equity-backed companies, segmented by higher growth versus lower growth.
Shown as a preview with credit and a link to the original. Publishers can request removal.
View the original on saas-capital.com