Charts / Clouded Judgement (Altimeter)
EV / NTM Revenue Multiples
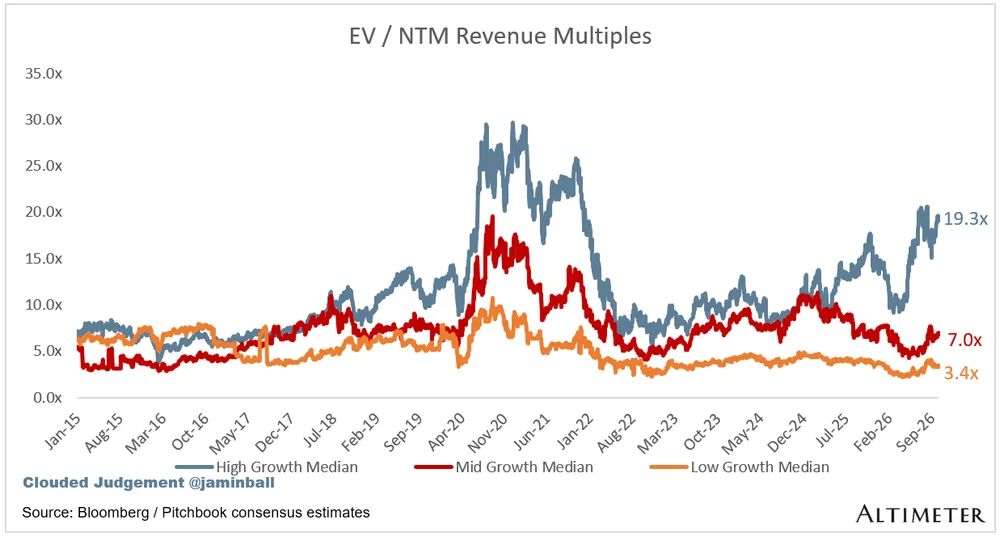
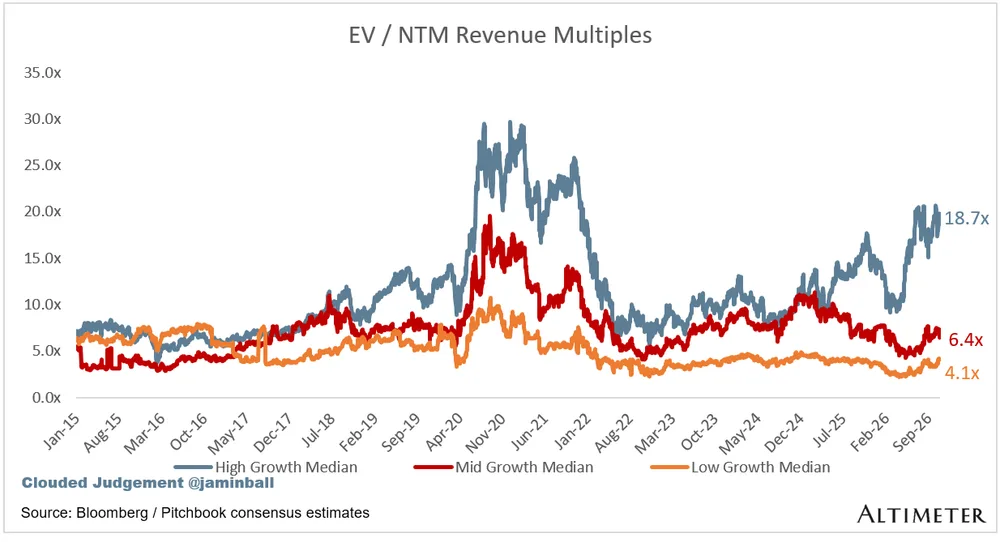
This line chart tracks Enterprise Value to Next Twelve Months (EV/NTM) revenue multiples categorized by company growth rates from January 2015 through September 2026. High growth companies currently trade at a median multiple of 19.3x, significantly outperforming mid growth (7.0x) and low growth (3.4x) peers.
| Label | Value shown on the chart |
|---|---|
| High Growth Median | 19.3x |
| Mid Growth Median | 7.0x |
| Low Growth Median | 3.4x |
Shown as a preview with credit and a link to the original. Publishers can request removal.
View the original on cloudedjudgement.substack.com