Charts / Clouded Judgement (Altimeter)
EV / NTM FCF Multiples
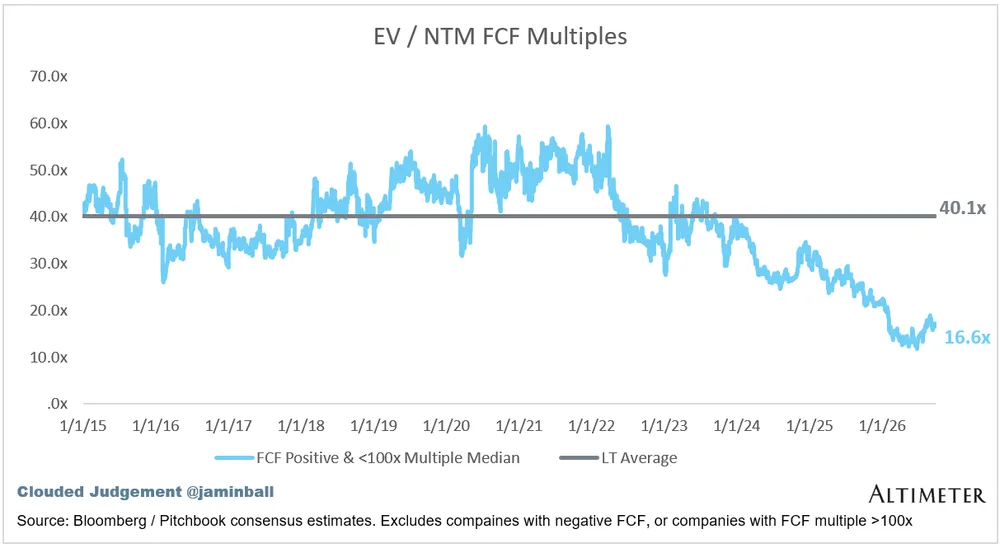
This line chart tracks the EV / NTM FCF multiple median for FCF-positive companies with multiples under 100x from 2015 to 2026. It highlights a long-term average of 40.1x compared to the latest level of 16.6x.
| Label | Value shown on the chart |
|---|---|
| LT Average | 40.1x |
| Latest FCF Positive & <100x Multiple Median | 16.6x |
Shown as a preview with credit and a link to the original. Publishers can request removal.
View the original on cloudedjudgement.substack.com