Charts / New Enterprise Associates
Compute Scaling Across Grok Model Generations
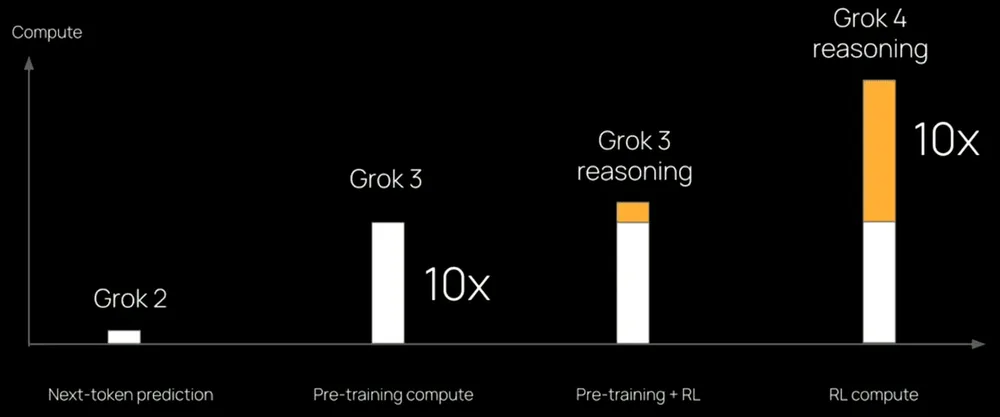
The chart illustrates the scaling of compute requirements across different Grok models, highlighting 10x relative increases during pre-training and reinforcement learning compute stages.
| Label | Value shown on the chart |
|---|---|
| Grok 2 | Next-token prediction |
| Grok 3 | 10x |
| Grok 3 reasoning | Pre-training + RL |
| Grok 4 reasoning | 10x |
Shown as a preview with credit and a link to the original. Publishers can request removal.